
Leading MPs condemned as more constituents suffer ‘avoidable ill-health’
Health equity expert Professor Sir Michael Marmot has called for action.

Dozens of MPs, including former prime minister Liz Truss, Levelling Up Secretary Michael Gove and former health secretary Steve Barclay have been criticised after new analysis revealed people in their constituencies are “suffering avoidable ill-health and living shorter lives than they should”.
One of the world’s leading health equity experts, Professor Sir Michael Marmot, has written a damning letter to 58 MPs across England to highlight “particularly concerning health trends” in their constituencies.
New analysis, by academics from the Institute of Health Equity at University College London (UCL), highlights which local areas are “falling behind” when it comes to health.
They identified 17 local authorities with statistically significant increases in inequalities in life expectancy between 2010-12 and the start of the Covid-19 pandemic.
Sir Michael has written letters to the 58 MPs whose constituencies lie wholly or partially in these areas.
They include Culture Secretary Lucy Frazer, Conservative Party chairman Richard Holden, justice minister Edward Argar, former immigration minister Robert Jenrick, and former health minister Maggie Throup.
“We need you to fight for all your constituents’ health. They are suffering avoidable ill-health and living shorter lives than they should due to poor policies and cuts to essential services,” Sir Michael wrote.
He has also written to the leaders of all major political parties demanding action.
In his letter to Prime Minister Rishi Sunak, Sir Michael, who published a seminal review into health inequalities in England in 2010, said austerity and funding cuts have “harmed health and worsened health inequalities” and that life expectancy is “stalling” which is a “tragic waste”.

Key findings from the new report, shared with the PA news agency, include:
– Areas where life expectancy inequality “significantly increased” between 2010-12 and 2017-19 include Rotherham in South Yorkshire and Kensington & Chelsea in London for females, and County Durham and Cornwall for males.
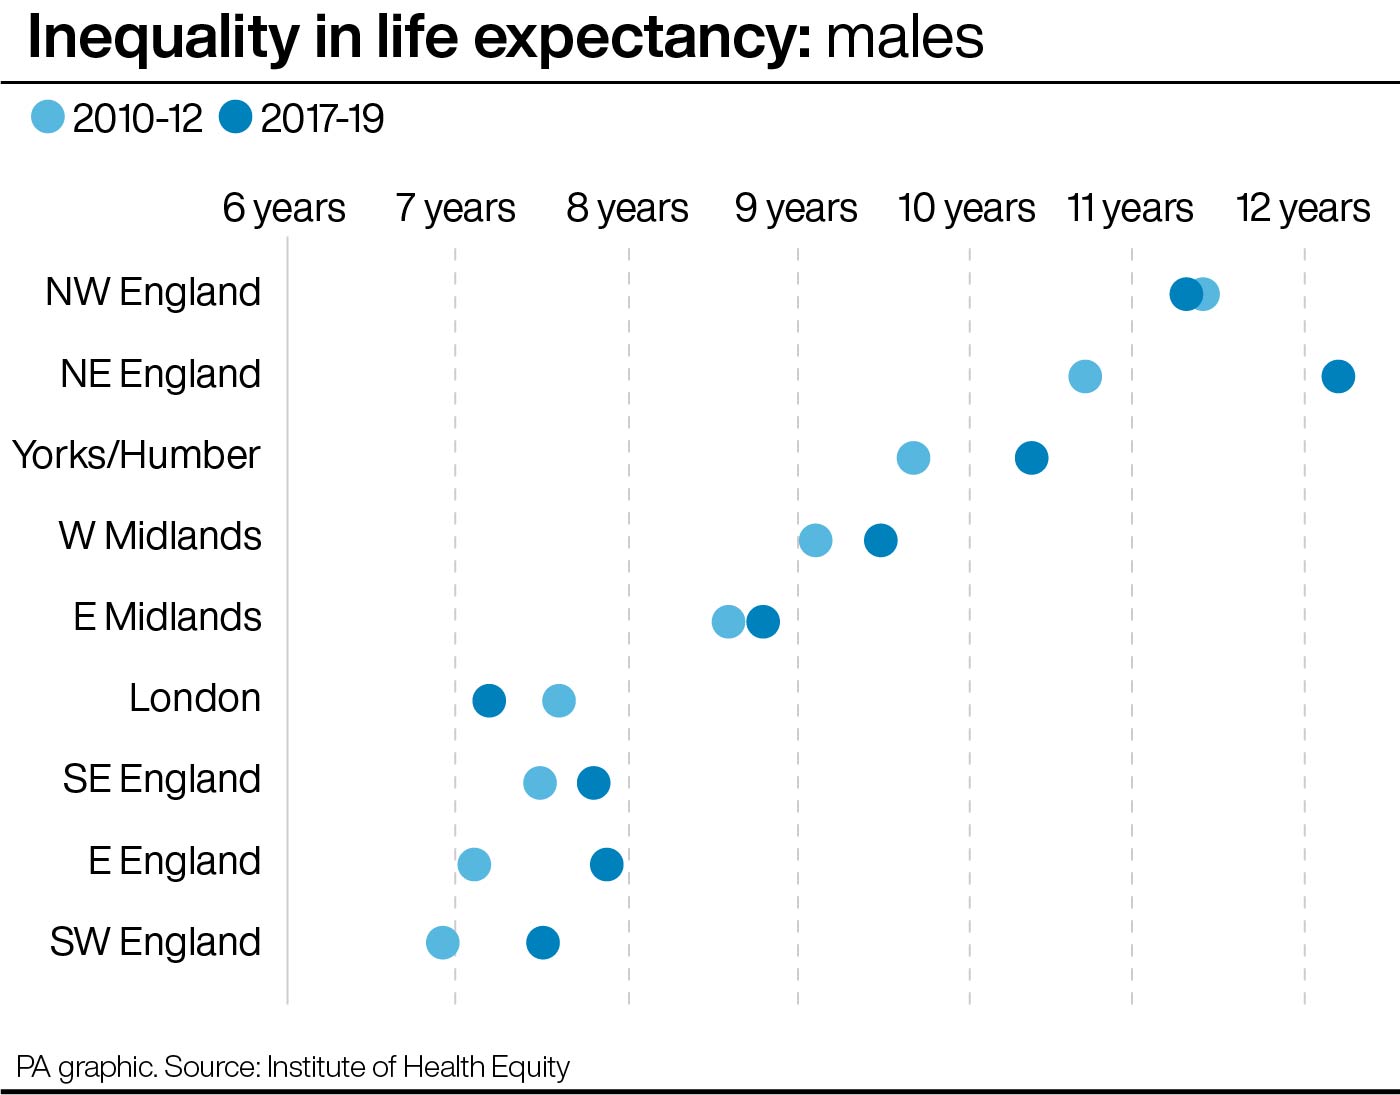
– Inequalities in life expectancy increased nationally between 2010/12 and 2017/19. Inequalities in life expectancy for women increased significantly in the North East, North West, Yorkshire & the Humber, East of England, East Midlands, and the South West. For men they increased in the North East, Yorkshire & the Humber, and the East of England.
– Since 2010, cuts to local authorities meant their spending power per head of population had fallen by an average of 34% across England by 2019/20.
– Healthy life expectancy – how long a person can expect to live in good health – is improving across Europe, but is getting worse in the UK.
“If you slash the services that support people then health will be harmed. Levelling up was supposed to provide badly-needed funding for the most deprived areas. But it was a derisory amount and, as a result, never going to improve health.”
He added: “This is a dismal state of affairs. I’m saying to party leaders: stop policies harming health and widening health inequalities.
“To MPs: if you care about the health of your constituents, you must be appalled by their deteriorating health. It’s time for action and political leadership across the board.
“Action is needed on the social determinants of health – the conditions in which people are born, grow, live, work and age. These social conditions are the main causes of health inequalities.”
UCL identified 14 local authorities in England where the difference in female life expectancy between the least deprived and most deprived neighbourhoods showed a “significant increase” between 2010-12 and 2017-19, along with three local authorities where the same occurred for males.
For females, these include Kensington & Chelsea in London, where the difference in inequality grew over this period from 6.2 to 11.9 years, Guildford in Surrey (2.8 to 8.0 years), Stoke-on-Trent in Staffordshire (4.8 to 8.9 years), and Rotherham (6.6 to 10.4 years).
There was a significant increase for males in Erewash in Derbyshire (up from 4.9 to 9.5 years), County Durham (7.4 to 9.8 years) and Cornwall (4.3 to 6.5 years),
More than half of authorities saw an increase in life expectancy inequality for both males and females from 2010-12 to 2017-19 – but no authorities recorded a statistically significant decrease.
At a regional level, north-east England saw the biggest gap in life expectancy between the least deprived and most deprived neighbourhoods in 2017-19, at 12.2 years for males and 9.7 years for females, followed by north-west England (11.3 and 9.6 years respectively) and Yorkshire & the Humber (10.4 and 8.5 years).
The regions with the lowest inequality were all in the south: London (7.2 years for males and 5.1 for females), the South West (7.5 and 5.6 years respectively) and the South East (7.8 and 6.1 years).
North-east England recorded the largest increase in inequality for both male and female life expectancy from 2010-12 to 2017-19.
A Government spokesperson said: “As set out in our Levelling Up White Paper, we are committed to narrowing the gap in healthy life expectancy by 2030 and to increasing healthy life expectancy by five years by 2035.
“Our upcoming Major Conditions Strategy will help us do this, by tackling the key drivers of ill-health in England.
“We are also investing £15 billion in local communities across the UK as part of our long-term plan to level up, ensure opportunity is spread more equally and to reduce inequalities.
“We have given councils in England up to £64.7 billion through the Government Finance Settlement for 2024 to 2025, an increase in Core Spending Power of up to £4.5 billion or 7.5% in cash terms.”


